With monday.com, you can map almost anything - including, of course, the most diverse management models and goal-setting methods.
In this article, we would like to share the details of how you can map the OKR method easily and quickly with monday.com while always keeping a perfect overview.
What are the advantages of the OKR method?
To use the method successfully at your company and to achieve the defined goals, two things are particularly important: full transparency and the possibility to get measurable results. Defining your objectives and key results helps organise the work effectively and ensures that you don’t lose track of the overall goal.
How does monday.com help me with this?
Monday.com offers almost unlimited possibilities. To get started, you can use a variety of templates, which you can optimise and adapt to your specific needs at any time.
You can create an OKR board for each quarter or display all quarters in one board. In the example, we will look at an OKR board for one quarter.
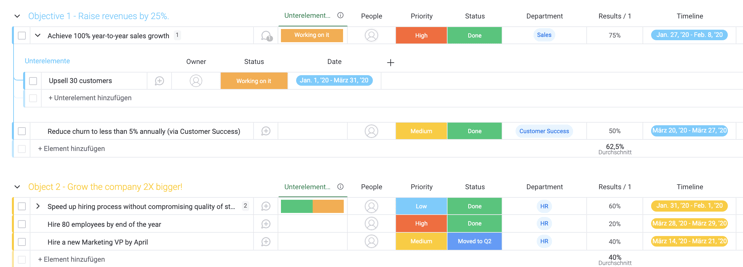
You can define objectives within the groups in the respective board.
At monday.com, each element stands for a key result, which can be filled with various columns. For example, the person column may be used to select a responsible employee, the status column may be used to assign priorities and present the current status.
The timeline column shows us when the respective goal is to be achieved and, using the drop-down menu, we can see which department is responsible. Within a number column, the percentage of achieved key results can be recorded in individual time intervals.
Any additional necessary steps and small interim goals within the key results can be displayed as sub-elements and quickly and easily assigned to the respective individuals.
By adding further columns, you can display almost everything here, creating maximum transparency of the current status. In addition, everyone involved knows exactly what they are responsible for and when the goal needs to be achieved.
Visualise your data
Compile a clear and organised dashboard on monday.com with just a few clicks. See all your goals at a glance and know exactly when to take which action.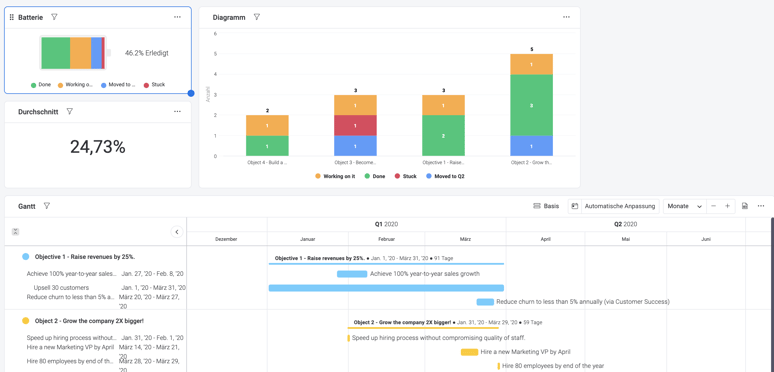
The monday.com dashboards and widgets offer you a clean and clear analysis of your data. The battery widget can help you see how many key results have been achieved so far and which topics may need to be looked at more closely.
The diagram widget allows you to display the number and status of key results, for instance, grouped by different objectives. You can set up the diagram to exactly fit your needs. Want to see the key results per department or employee? Just a few minor adjustments and it’s done!
With the help of the Gantt view, you can display all key results at a glance and adjust the deadline if needed. Here as well, many other evaluations can be mapped. Thanks to the dashboards, you can combine the data from the different boards for each quarter and create a complete overview any time.
Discover the possibilities with monday.com
Automations and integrations make it easy to integrate your favourite tools such as Slack, Gmail, Outlook, Zoom, Salesforce etc. into your process. This way, reaching your goals becomes even more seamless. Map your OKR management with monday.com and have fun exploring the many creative options!
Want to learn more about the possibilities of monday.com? Need help setting up your workflows?